Geospatial data engineering / Project study
Inner West POI Analysis
From a government API to a relational database and interactive exploration of 21 Inner West suburbs.
Data pipeline · Spatial analysis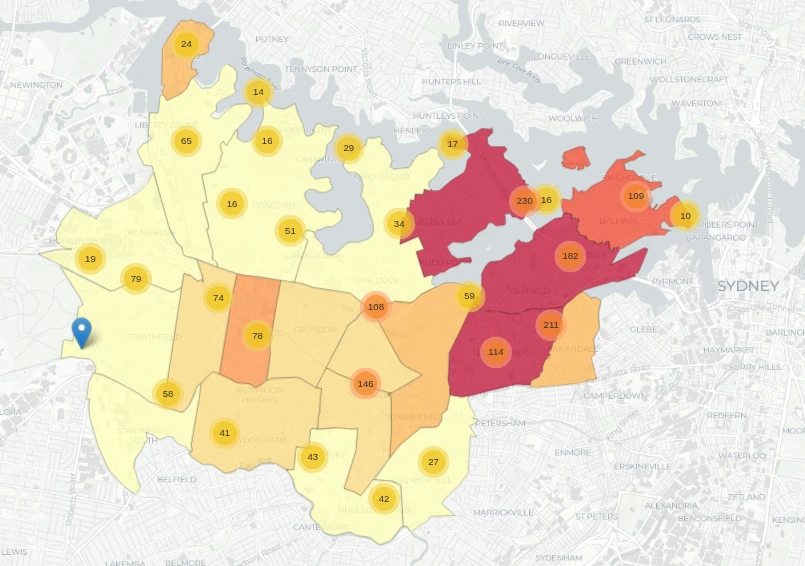
Explore the Inner West
MAPPan and zoom across the suburbs, then select a cluster or marker to explore the points of interest.
Open map in a new tab ↗Interactive map loads mapping libraries and OpenStreetMap tiles from external services. Map data © OpenStreetMap contributors. A static preview is available in Screens & outputs below.
The problem
01Points-of-interest data becomes more useful when it can be related to places people recognise. This project explores how POI density and categories vary across Sydney’s Inner West suburbs, connecting ingestion, relational analysis and geographic exploration.
Team & contribution
A portfolio data project connecting ingestion, relational analysis and geographic exploration. The linked repository provides the implementation context.
Approach & architecture
02Fetch
3,744 POIs from the NSW ArcGIS REST API
Match
Transform and match source records
Load
1,913 matched records across two PostgreSQL tables
Explore
SQL analysis and an interactive map of 21 suburbs
Conceptual system flow, based on the project summary.
Engineering decisions
03Separate acquisition from ingestion
The pipeline fetched 3,744 POIs, while 1,913 matched records were ingested across two tables. Keeping these stages distinct prevents the raw source count from being mistaken for the analysed database population.
Use relational queries for geographic questions
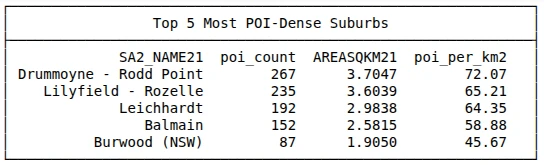
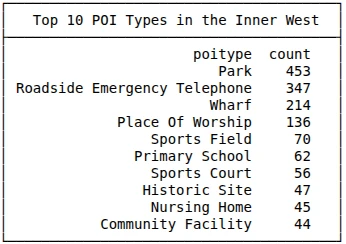
Python processing and SQLAlchemy connect the API data to PostgreSQL. SQL queries explore density, POI types and suburb-level patterns before the results are presented spatially.
Make spatial patterns explorable
An interactive map complements the database analysis across 21 Inner West suburbs, letting a reader connect aggregate patterns to geographic context.
Constraints & trade-offs
04The findings describe the records captured and matched by this pipeline. Source coverage and matching affect what appears on the map; the counts should not be read as a complete census of every local amenity.
Outcome & reflection
05An end-to-end workflow: 3,744 POIs fetched, 1,913 matched records ingested across two PostgreSQL tables, and analysis and visualisation across 21 suburbs.
The distinction between fetched, matched and analysed data is central to communicating results honestly. A useful next step would be to document unmatched records and assess how source coverage varies by suburb.
Screens & outputs
3 IMAGESSelect an image to open it at full size.