Interactive statistical analysis / 2026
DATA Psychics
An R Shiny application exploring associations between student lifestyle factors and academic performance.
DATA2902 · Group project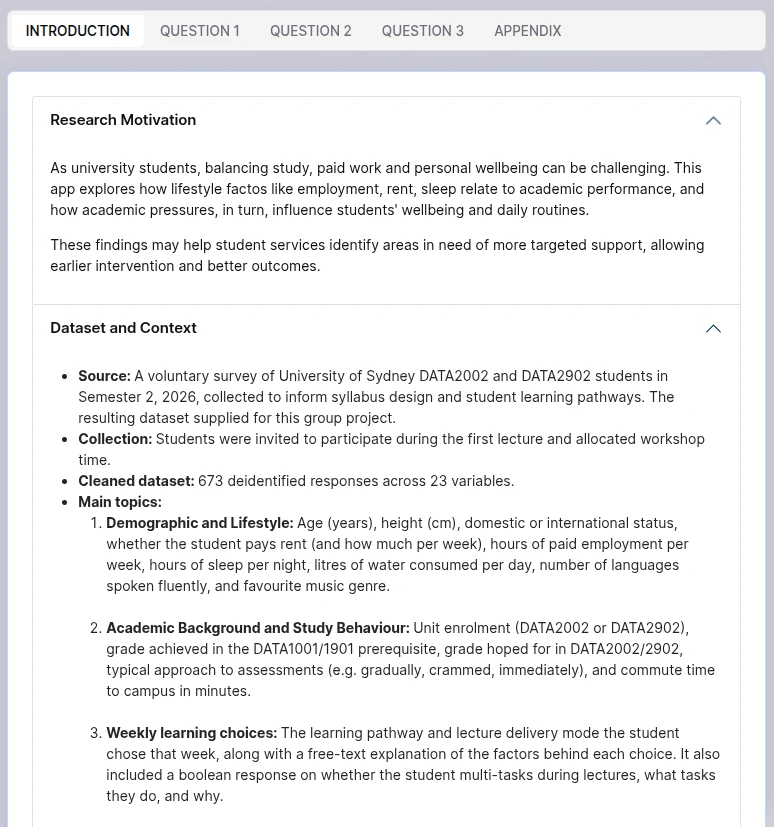
The problem
01A statistical result is difficult to interpret without its question, assumptions and visual context. Our application brings these elements together to explore relationships between student lifestyle factors and academic performance.
Team & contribution
A DATA2902 group project at the University of Sydney in 2026. Analyses and the application are presented as shared team work.
Approach & architecture
02Prepare
R and tidyverse data processing
Test
Chi-square, CMH and two-sample comparisons
Simulate
Monte Carlo and permutation testing
Explain
Shiny, ggplot2 and plotly interactions
Conceptual system flow, based on the project summary.
Engineering decisions
03Match the method to the question
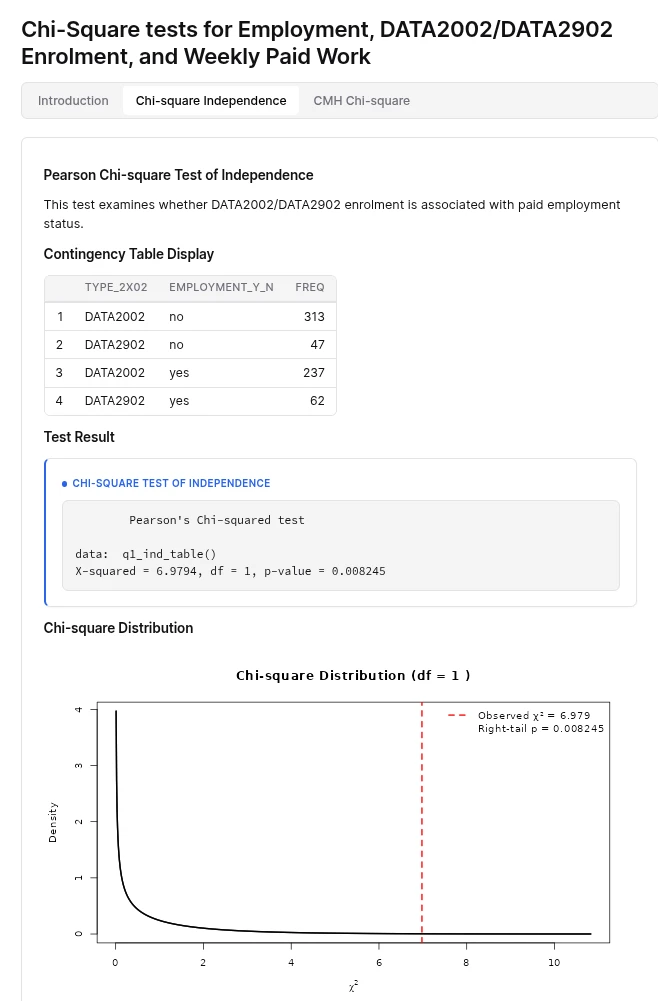
The work includes Pearson’s chi-square test of independence, Cochran–Mantel–Haenszel analysis and two-sample comparisons. Each method gives a different view of the relationships under investigation.
Show reasoning alongside results
Interactive hypotheses, assumptions and visualisations help users understand what a test asks and what its output can support. The interface is part of the statistical explanation.
Include simulation-based methods
Monte Carlo and permutation testing complement the other analyses. These methods give the project a broader statistical toolkit without turning an observed association into a causal claim.
Constraints & trade-offs
04The application explores associations, not causes. Results need to be read alongside their hypotheses, assumptions and the underlying data. The Shiny application is hosted externally and may take a moment to start.
Outcome & reflection
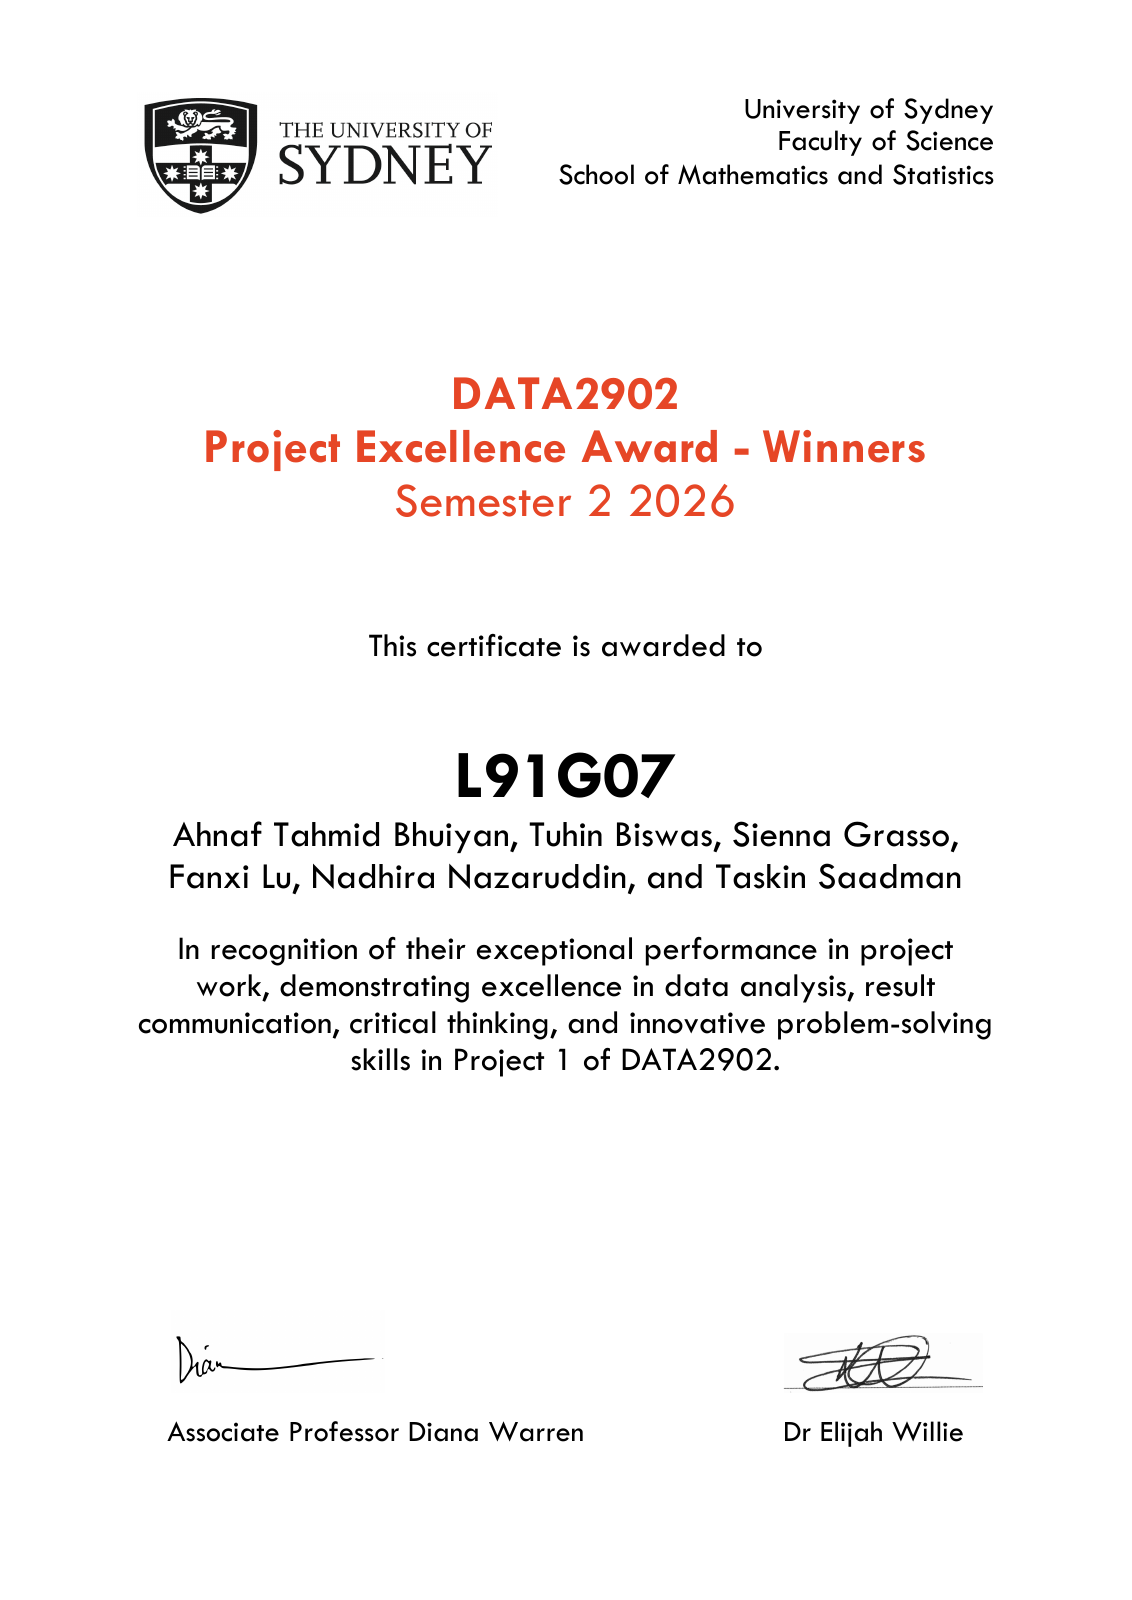
05Our team received the DATA2902 Project Excellence Award - Winners for Project 1 in Semester 2, 2026. The award recognises excellence in data analysis, result communication, critical thinking and innovative problem-solving. Our application combines R-based methods with explanatory visualisations and a Shiny interface.
Statistical communication is an interface problem as well as an analytical one: readers need to see the assumptions and question behind a result before drawing conclusions.
Screens & outputs
3 IMAGESSelect an image to open it at full size.